Whole-system observability: discovering unknown unknowns with continuous profiling
Track Pulpito - Friday 16:40-17:20
🇪🇸
Speaker
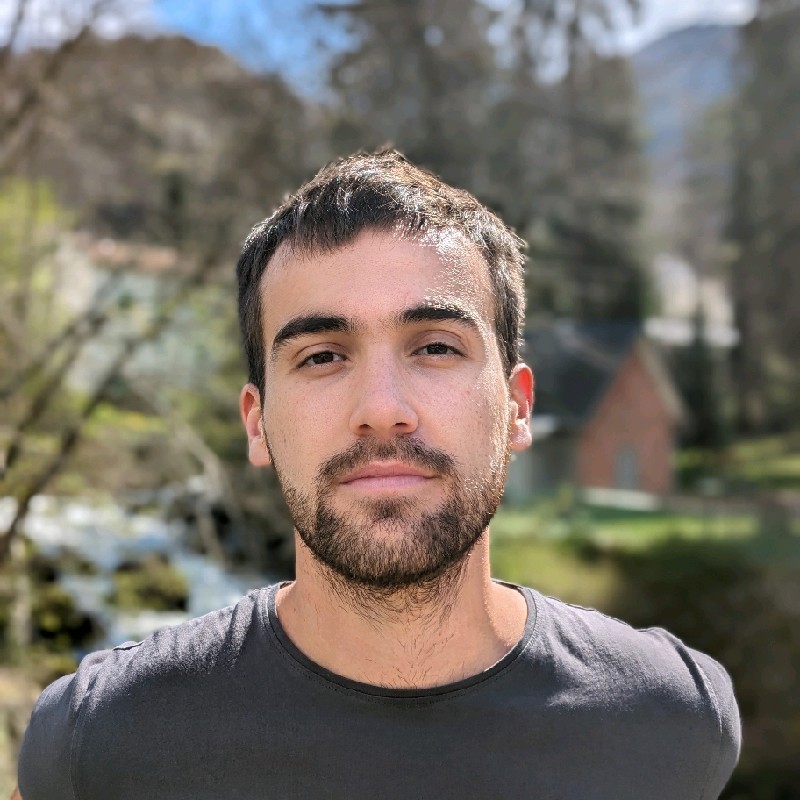
 Roger CollComputer Engineer @ Elastic
Description
Observability has long revolved around the three pillars—metrics, logs, and traces—but profiles are rapidly emerging as the missing piece for whole-system insight. In this talk, we’ll explore how continuous profiling enables developers to move beyond surface-level telemetry and uncover unknown unknowns in real-world systems. We’ll dive into the architecture of the OpenTelemetry eBPF Profiler, explain how stack unwinding and symbolization work across languages, and highlight the profiler’s current language support. To wrap up, we’ll demonstrate how the Elastic's Devfiler tool and the OpenTelemetry eBPF Profiler can reveal hidden performance issues in the OpenTelemetry Demo, showing how profiles unlock a new dimension of observability.